✅Understanding the position and your appearance on search engines is crucial for higher traffic to your website. This article will break down how Google and different search engines work to create your sites search results✅
Keyword history
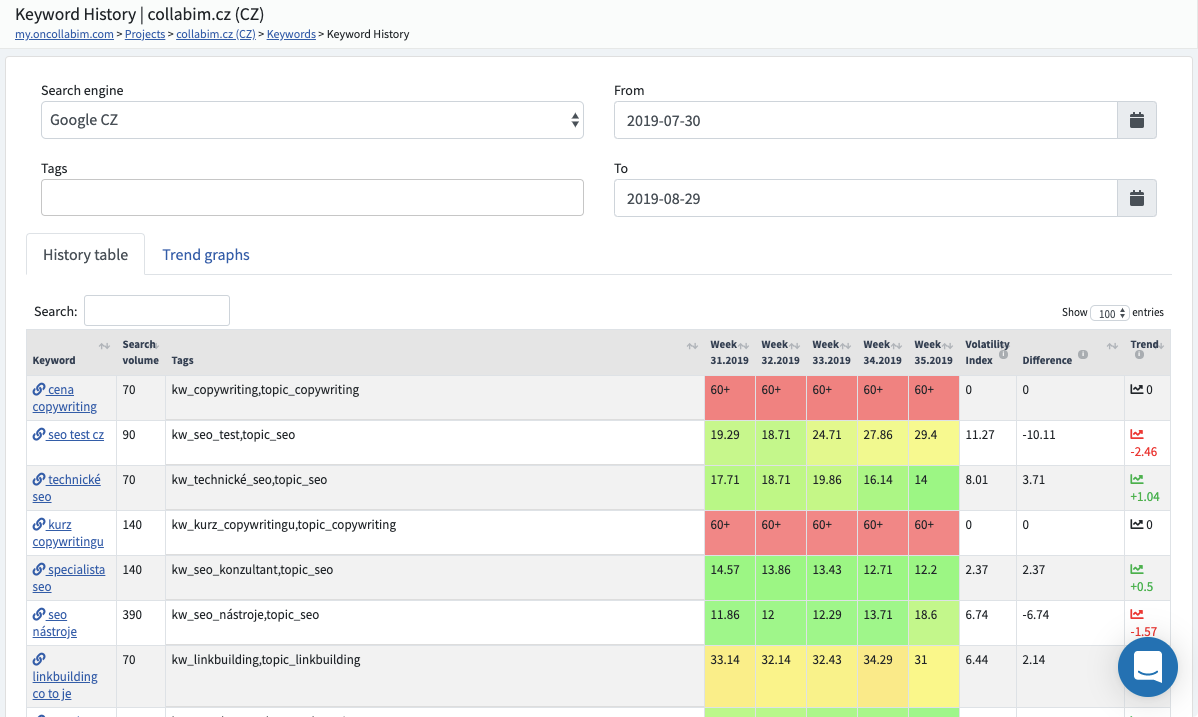
In the section 'Keyword History' you can find the position development of your keywords over time.
The keyword development and statistics can be viewed in History Table.
You can also select the period you are interested in. By setting the period will be averaged:
- the selected range is within 14 days - positions are not averaged, the detected positions are displayed
- the selected range is 14 days to 90 days - averages over weeks
- the selected range is 90 days to 1 year - averages over the months
If you want find some keyword very quickly, just enter it in the Search box. In the report there are important columns, each column indicates:
- volatility index - the sum of all absolute changes of positions in a line and expresses how frequently the keyword has been changing its position
- the difference - the difference between the first and the last position of the keyword so that you can easily see if the keyword has moved up or down
- trend - the graph indicating whether the keyword has been falling or rising and how much
Next to the History Table you will find Trend graphs which show the average keyword positions for each date and the overall trend in the graphs.
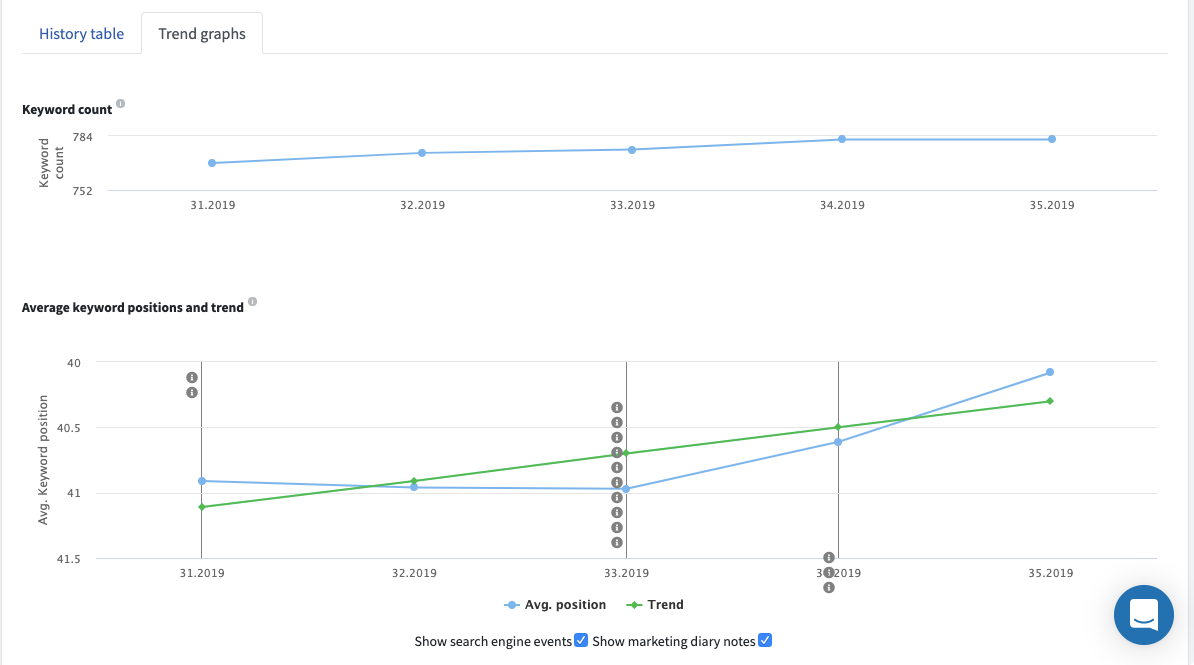
The red curve expresses the trend, i.e., whether the keyword position either increased or decreased over the selected time period. The blue curve represents the development of positions.
On the graph there are also Marketing Diary Notes so that you can see what you were doing in marketing on that date.
You can also view the Search engine events, which show if any update or algorithm change caused some shift of your positions.
How do we count the trend?
Trend curve equation: Y = a + bX
where:
b = (sum (x * y) - sum (x) sum (y) / n) / (sum (x ^ 2) - sum (x) ^ 2 / n)
a = sum (y) / n - b (sum (x) / n)
b is in this case the trend line given in the last column and expresses the slope of the curve.
You can find simulation on real data with gradual calculation here.